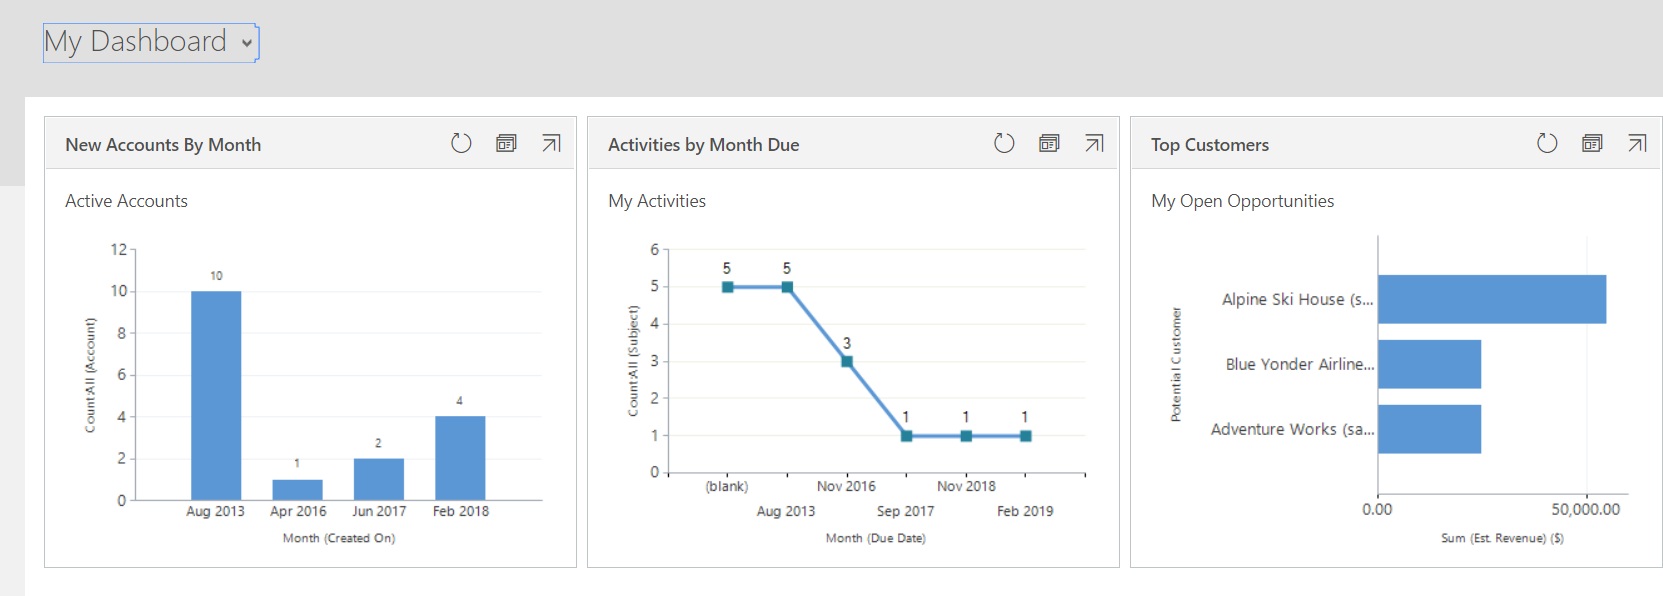
Dashboards within Engage allow users to reference a visual interface that consolidates key business data and metrics. Charts, graphs, and lists help you understand trends and patterns in your business.
Within Engage, you can have Personal dashboards and System dashboards. Personal dashboards are customized and visible by individual users, and System dashboards are created and customized by your System Administrator, and available to all users.
Watch this short video to learn more about Personal Dashboards.
All users can choose their default dashboard by clicking on Set As Default.
![]()
To create a new Personal Dashboard go to Menu > Dashboard > +New > Dynamics 365 Dashboard > Choose Layout > Create

Layout Options
You can choose the Layout of your Dashboard, and this can be adjusted as you're editing your Dashboard. The square components work best with charts, and the rectangular components work best with lists or tables in the dashboard. Charts must already be created on your Personal or System Views before they can be added to the Dashboards. To create your own chart, take a look at this article Create or edit a chart.

Adding Components
For each square, you can add a Components. Generally, you should use Chart, List, or Timeline (List of Activities). The others require extensive technical knowledge and configuration (see below).
1. Name your Dashboard (required)
2. Select a tile and click Chart (or List)
3. Choose a Record Type. This is where you will choose the Entity that should be included in the Chart or List (i.e. Relationship or Contact).
4. Choose a View. You can choose from either Personal or System Views that already exist within your CRM. Create your own views in Engage.
5. Choose a Chart. Create or edit a chart.
6. Click Add.
Repeat these steps to add additional charts and lists to your dashboard, then click Save. When you have finished configuring your Dashboard, click Close.


The following components are also available for dashboards, however, they require extensive technical knowledge and configuration. Work with your system administrator or IT department if you'd like to add the following components:
- Web resource- Web resources are virtual files stored in the system. Each web resource has a unique name that can be used in a URL to retrieve the file. More information: Create or edit web resources to extend an app
- Iframe- Used to display the contents from another website. More information: Use IFRAME and web resource controls on a form
View your Dashboard
Your dashboard is displayed in the Dashboards area where you can share or assign it to another user or team. You can also set it as your default dashboard.

Create System Dashboards
In Engage, System Administrators have the ability to create System Dashboards for their firm for all users to view and use.
Watch this short video to learn how to create System Dashboards in Engage.


